Publikálva:
M. NEMÉNYI – A. LŐRINCZ (2002): Appreciation
of an complex ultrasound system according to survival
cell count. Hungarian Agricultural Engineering.
APPRECIATION OF AN COMPLEX ULTRASOUND SYSTEM
ACCORDING TO SURVIVAL CELL COUNT
Summary
The decreasing of micro-organism
cell count the most important task of the food industry. The killing of microbe no too
difficult thing rather the preserve of essential food components is the heavey
work. The modern microbe destructor technologyes its effects
goals only the pointed objects and dont touchs the other essential food
components. Our experimental work goals this philosophy with ultrasound.
We examinated the surviving cell count of Saccharomyces cerevisiae suspension.
This cell suspension was of an closed liquid circuit
system streaming with peristaltic pump. The cell count with manual and
automatical detection system was examinated and the experimental method based
on vital staining with methylen blue and on the cell counting. The results gives possibility any cell phase analytical and
continuous cell decreation system developing. This work is fundamental
research.
Introduction
There is no cavitation
in the ultrasound field until the amplitude of the acoustic pressure exceeds a
certain level, the cavitation threshold [1]. Cavitation threshold is
proportional with the frequency of ultrasound, with the hydrostatic pressure in
the liquid, and with the viscosity of the sample and it is inversely
proportional with the gas content and
temperature of the sample [2]. There are two types of cavitation that are
stable and transient cavitation [3]. Basically two reactions take place when ultrasound and a media
interact with each other. One of them is the absorption the other one is the
scattering, which changes e.g., the speed of propagation of the sound in the
subject media [4]. Due to the absorption, the intensity of ultrasound decreases
exponentially with distance and the absorption coefficient primarily depends on
the speed of propagation of the sound in the subject media, on the wave type,
on the material situated in the ultrasound field and on the frequency. The
absorption always characterizes a media, a structure or an environment that
determines the parameters of propagation [5]. When absorption coefficients were
measured in oxo- and és methemoglobin, it was observed that the absorption is
proportional with the concentration of hemoglobin in the concentration range
between 0 and 15 [g/100ml] [6]. It
was clearly established that the profile of the ultrasound propagation
speed depends on the concentration profile of the suspension [7]. Effects of
the size and concentration of the suspended particles on the propagation speed
of ultrasound was examined in water based suspensions. It was established that
the speed of sound largely depended on the particle size and concentration [8].
In vitro cavitation threshold measurements were carried out in human blood. In
the fresh blood that contained every blood component, the amplitude of the
acoustic pressure belonging to the cavitation threshold was higher than in
diluted blood [9]. Due to cavitation caused by ultrasound, acoustic streaming
was formed in the liquid [10]. Acoustic streaming is a movement of the liquid
that is caused by intensive ultrasound [11]. Mixing of liquid was experienced
in the ultrasound field due to acoustic streaming [12]. An acoustic reflector
placed opposite to the transducer causes a standing wave to be formed. In a
standing wave the materials whose density are lower and higher than of the
liquid drift to propagation cluster planes (pressure antinodes), and pressure
nodes, respectively [2]. The ultrasonic separation is used in analytical
biotechnology applications. This procedure is based on the fact that in a
standing wave field, where there is no cavitation, the cells are arranged in bands
distances of which are smaller than a millimeter and they can be separated from
these bands [13]. Yeast (Saccharomyces cerevisiae) and rubber particles
were manipulated in a standing wave ultrasound field at frequencies of 1 and 3
[MHz]. The particles formed bands in pressure nodes whose distance from each
other was equal to half of the wavelength. In the direction of the radiation
the bands formed column like structures. Stability of the bands, the conditions
under which they are broken and the formation of the acoustic streaming were
investigated in [14]. Effectiveness of the cell separation of Escherichia
coli bacteria and Saccharomyces cerevisiae yeast cells from a yeast
suspension was examined at frequencies of 1 and 3 [MHz] [16].
Materials and methods
As
experimental marker microorganism we suspended 1,8
gram yeast (Saccaromyces cerevisiae) in
200 cm³ distilled water with a magnetic mixer until it became clod free
and the cell concentration reached the level of 9x10⁷/ml. For the
sake of a better detection we put 5 drops of methylene blue into the solution,
which did not influence the vitality of the microorganism.
We put the suspension into a fluid flow system (Fig. 1.) of 116 cm3
of inner volume with a peristaltic pump. After the filling and short-circuit of
the system the suspension was circulated by a peristaltic pump between the
different structural units. The suspension was then not directly treated but
isolated from its environment by material flow through ultrasonic flow cuvettes
(Fig. 2.) especially made for this purpose. The ultrasonic cuvettes allow the
suspension to flow with a surface of 1 cm2 and a thickness of 0.5 mm. There were two cuvettes placed 1 cm apart at right
angles to the flow direction. The reason for this arrangement was that the
effects on the liquid film are much easier to observe than inside the material.
In order to avoid cell
sedimentation an efficiently high rate of flow was applied: 50-70 cm/sec (4-5
cm3/sec). The suspension flowing in the ultrasonic cuvettes were
exposed at a frequency of 0.8 MHz and at a capacity of
10 W/cm2. The suspension
flowing in the system gets into an optical detection cell placed in a
biological microscope. The picture gets then from here through a CCD camera
into a computer system, where it will be saved according to time units. Which
will allow evaluating the cell disruption effect of the treatment based on
calibration. After short-circuit the flow system and turning on the ultrasonic
system there were drop samples taken at time units through a built-in tap. The
samples were immediately analyzed under a Bürker chamber. A thermostat unit also belongs to the system,
which ensures a constant temperature for the reproduction of the tests.
The survive cell analysis is based on a vital stain, which means that
under microscope with Bürker-chamber. The dead cells are stained blue owing to
methylene blue but the living organisms remain clear. We can establish the
curve of deteriorated and survived cells owing to ultrasonic treatment as blue
stained and clear cells are counted at regular time units. Organisms are
regarded as cells, which have
intact cell walls and reflect vitality. We want to mention this
fact because after a certain time of treatment cell lysis will happen.
Treatment definition
The treatment
means a certain period of time during which the amount of liquid circulating in
a flow system is exposed to a physical (ultrasonic) treatment of a given
capacity during a given period.
The time of
treatment means in the flow system the period between the turning on and
turning off the ultrasound. This period was taken into account during the
evaluation of the results.
As for the
amount of liquid the time of treatment had to be corrected in the flow system
concerning the total amount of liquid flowing in the system and the total time
of treatment. Therefore the total liquid treatment time of „A”
is required to reduce the original cell
count to its hundredth where „B”=116cm3 is the total amount of flowing liquid in our system. So 1 cm3
of cell suspension has to be treated at „A/B” minute.
Results and discussion
Treatments
were carried out at 0,8 MHz and with a capacity of 7,5
W/cm2; 9,6 W/cm2; 10,5 W/cm2 and 12 W/cm2
by taking samples from the suspension at defined times. These samples were then
evaluated in Bürker chambers based on the average living and dead cell numbers
to be observed. Figure 3 showed the relative percentage of survive cell counts
in the samples. According our examinations the relative surviving cell counts
of one milliliter treated suspension showed on table 1. On fig. 3. the ♦ = 7,5 W/cm2, ■ = 9,6 W/cm2,
∆ = 10,5 W/cm2, X = 12 W/cm2 are the points
belonging to the ultrasonic treatments
and the functions fitted to them (Fig 4.). The relative living cell
counts signified by the different symbols show that more drastic and faster
cell destruction is to be observed depending on the time passed if we applied
higher capacities. In table 1 the relative cell counts refer to 22 cells per
Bürker chamber owing to creating the model function, which indicate an initial
cell count of 88 million/millilitre. In
order to set up a model formula we set different trend functions onto the
points. The logarithmic trend functions showed the highest correlation with the
measured points. Setting trend functions on to the additive and multiplying
factors of the logarithmic functions resulted in the formula shown in table 2.
where „a” is the trend function referring to the additive factor and „b” is the
trend function referring to the multiplying factor. Cell count can be omitted from the
model formula as it refers to the initial cell count of 22 cells/Bürker chamber
(cfu), so it has to be corrected by the actual cell counts respectively. This model
function helps to calculate the ultrasonic capacity that is required for
treating the material at a given initial cell count, so that it would reduce to
the required cell count after a certain period of time. Or it allows
determining the time needed to reach the required cell count at constant
ultrasonic capacity. Of course these values refer to a given system. Therefore
a correction factor is to be used for a general usage adapted to the actual
conditions. Figure 5. shows the
replacement of the treatment of 7.5 W/cm2.
Conclusion
The model function allows modelling the
effects of the ultrasonic treatment at a frequency of around 0,8 MHz and different capacities.
The
ultrasonic treatment can be adapted for use for treating agricultural products
if high quality is required.
Acknowledgement
We express out thanks
for the help of Prof. Dr. Pál Greguss from the Technical and Economic
University of Budapest.
References
[1] F. J.
Fry, Ultrasound: Its Applications in Medicine and Biology, Elsevier Scientific
Publishing Company, Amsterdam-Oxford-New York. 1978
[2] G.R. Ter Haar, Biological Effects of Ultrasound in Clinical
Applications. In: S.K. Suslick, Ultrasound, Its
Chemical, Phisical, and Biological Effets. VCH Verlagsgesellschaft mbH, Weinheim.
1988 pp 305-319.
[3] L.A Frizzel, Biological Effects of Acoustical Cavitation. In.: S. K. Suslick, Ultrasound, Its Chemical, Phisical, and
Biological Effets. VCH Verlagsgesellschaft mbH, Weinheim. 1988 pp 287-301.
[4] C.R. Hill,– R.C. Chivers,– R.W. Huggins,– D. Nicolas,
Scattering of Ultrasound by Human Tissue. In.: F. J.
Fry, Ultrasound: Its Applications in Medicine and Biology. Elsevier Scientific
Publishing Company, Amsterdam-Oxford-New York 1978 pp 441-493.
[5] H.
Kurtuff, Ultrasonics Fundamentals and Applications, Elsevier Applied Science,
London and New York. 1991
[6] E.L. Carstensen, H.P. Schwann,
Acoustic Properties of Hemoglobin Solutions, J. Acoust. Soc. Amer. 31 1959 p
305.
[7] D.J. Wedlock, C.J. McConaghy, S.
Hawksworth, Automation of ultrasound velocity scanning for concentrated
dispersions, Colloisd and Surfaces A: Physiochemical
and Engineering Aspects. 77 1993 pp 49-54.
[8] P.
Sayan, J. Ulrich, The effect of particle size and suspension density on the
measurement of ultrasonyc velocity in aqueous solutions, Chemical Engineering
and Processing. 41 2002 pp 281-287.
[9] C.X. Deng, X. Quihong, R.E. Apfel, C.K.
Holland, In vitro measurements of inertial cavitation thresholds in human
blood, Ultrasound in Med. and Biol. 22 1996 pp 939-948.
[10] A.H. Saad, A.R. Williams, Possible
mechanisms for the agitationinduced enhancement of acoustic cavitation in
vitro, J. Acoust. Soc. Am. 78 1985 pp 429-434.
[11] H.
Mitome, The mechanism of generation of acoustic streaming, Electronics and
Communications in Japan, Part 3. 81 1998 pp 1-8.
[12] D.J. Watmough, K.M. Quan, M.B. Shiran, Possible explanation for the unexpected absence
of gross biological damage to membranes of cells insonated in susupension and
in surface culture in chambers exposed to standing and progressive wave fields,
Ultrasonics. 28 1990 pp 142-148.
[13] W.T. Coakley, Ultrasonic separations in analitical
biotechnology, Trends in Biotechnology. 15 1997 pp 506-511.
[14] J.J. Hawkes, J.J. Cefai, D.A. Barrow, W.T. Coakley, L.G. Briarty, Ultrasonic manipulation of particles in
microgravity, J. Rhys. D: Appl. Phys. 31 1998 pp 1673-1680.
[15] J.J. Hawkes, M.S. Limaye, W.T. Coakley, Filtration of bacteria and yeast by ultrasound
enhanced sedimentation, Journal of Applied Microbiology. 82 1997 pp 39-47.
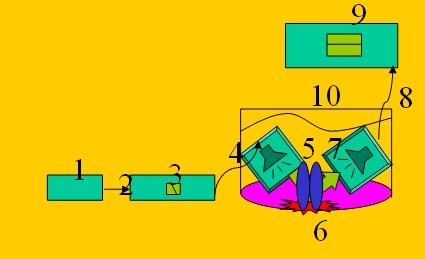
Figure 1.
The complete flow injection system. Key: 1. Peristartic pump, 2. Lead out tube,
3. Ultrasonic treating cuvettes, 4. Tube, 5. Tap 6. Optical flow cuvette, 7.
Lead in tube, 8. Stereomicroscope, 9. CCD camera, 10. Ultrasound transmitter,
11. Ultrasound receiver, 12. Echoless waterbath.
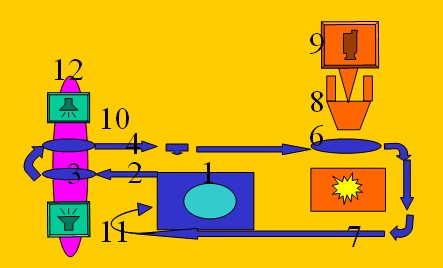
Figure 2.
The ultrasound system. Key: 1. Signal generator, 2. Electronic cable, 3.
Ultrasound amplifier, 4. Electronic cable, 5. Ultrasound transmitter, 6.
Reflection surface, 7. Ultrasound receiver, 9. Electronic cable, 9.
Oscilloscope, 10. Echoless watertank.
Table 1.
Relative surviver cell cell counts of one millilitre treated cell suspension
after different exposition times.
|
Ultrasound power Exposition time |
7,5 [W/cm2] 4 min 3
sec |
9,6 [W/cm2] 2 min 51
sec |
10,5
[W/cm2] 2 min 39
sec |
12 [W/cm2] 2 min 30
sec |
|
Rel
surv. Cell count |
1,7% |
0,9% |
0% |
0,8% |

Figure 3.
Relative survival cell
count (%)
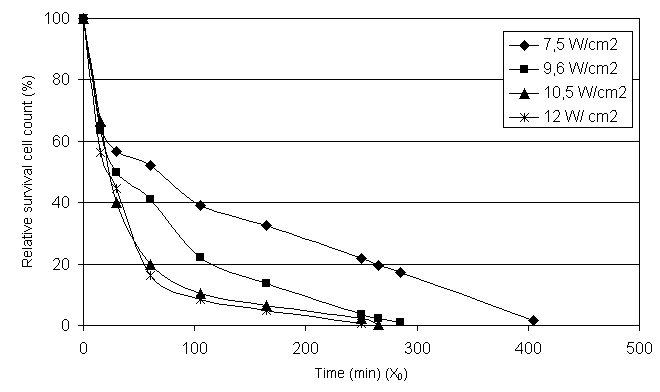
Figure 4. Relative survival cfu
Table 2. Complete
model function modelling the ultrasonic treatment of liquid suspensions
|
y=a*lnx0+b (x0=time, [min]) |
|
a=-1.9376*lnx1+0.4753 (x1= Ultrasound power, [W/cm2]) |
|
b=-1.5277*lnx1+26.567 (X1=
Ultrasound power, [W/cm2]) |
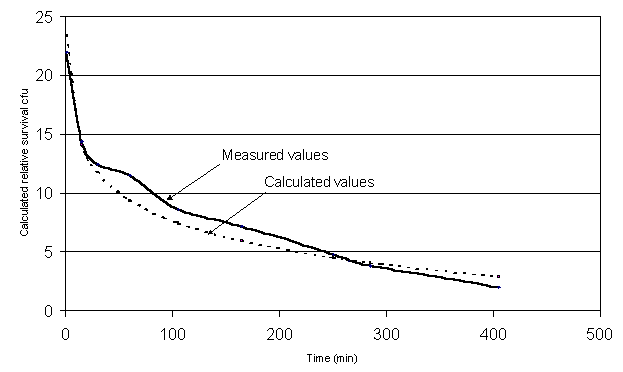
Figure 5.
Model function in relation to the real values